Private Wetterstation in D-19073 Klein Rogahn
Aktuelle Messwerte am Dienstag, den 27.10.2026 00:25:00 Uhr (Zeitzone: CET)
- Breitengrad: 53° 36.36' N
- Längengrad: 011° 20.48' O
- Höhe: 53 m ü. NHN
- Ortszeit: 00:10:21



VantagePro 2: Zunehmend bewölkt mit geringer Temperaturänderung.
Prognose erstellt: 27.10.2026 00:25:00 Uhr
Stationsmodell als SVG-Grafik
Zambretti: Schönes Wetter, eventuell Schauer
Prognose erstellt: 26.10.2026 09:00 Uhr
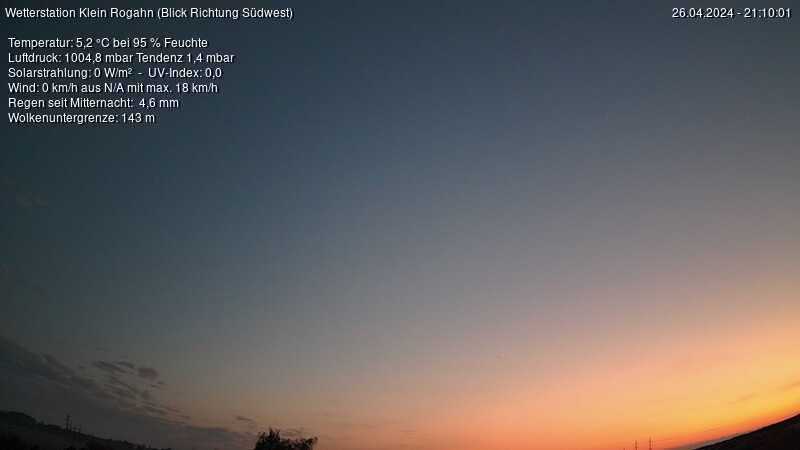
Wetter Kamera Richtung SW
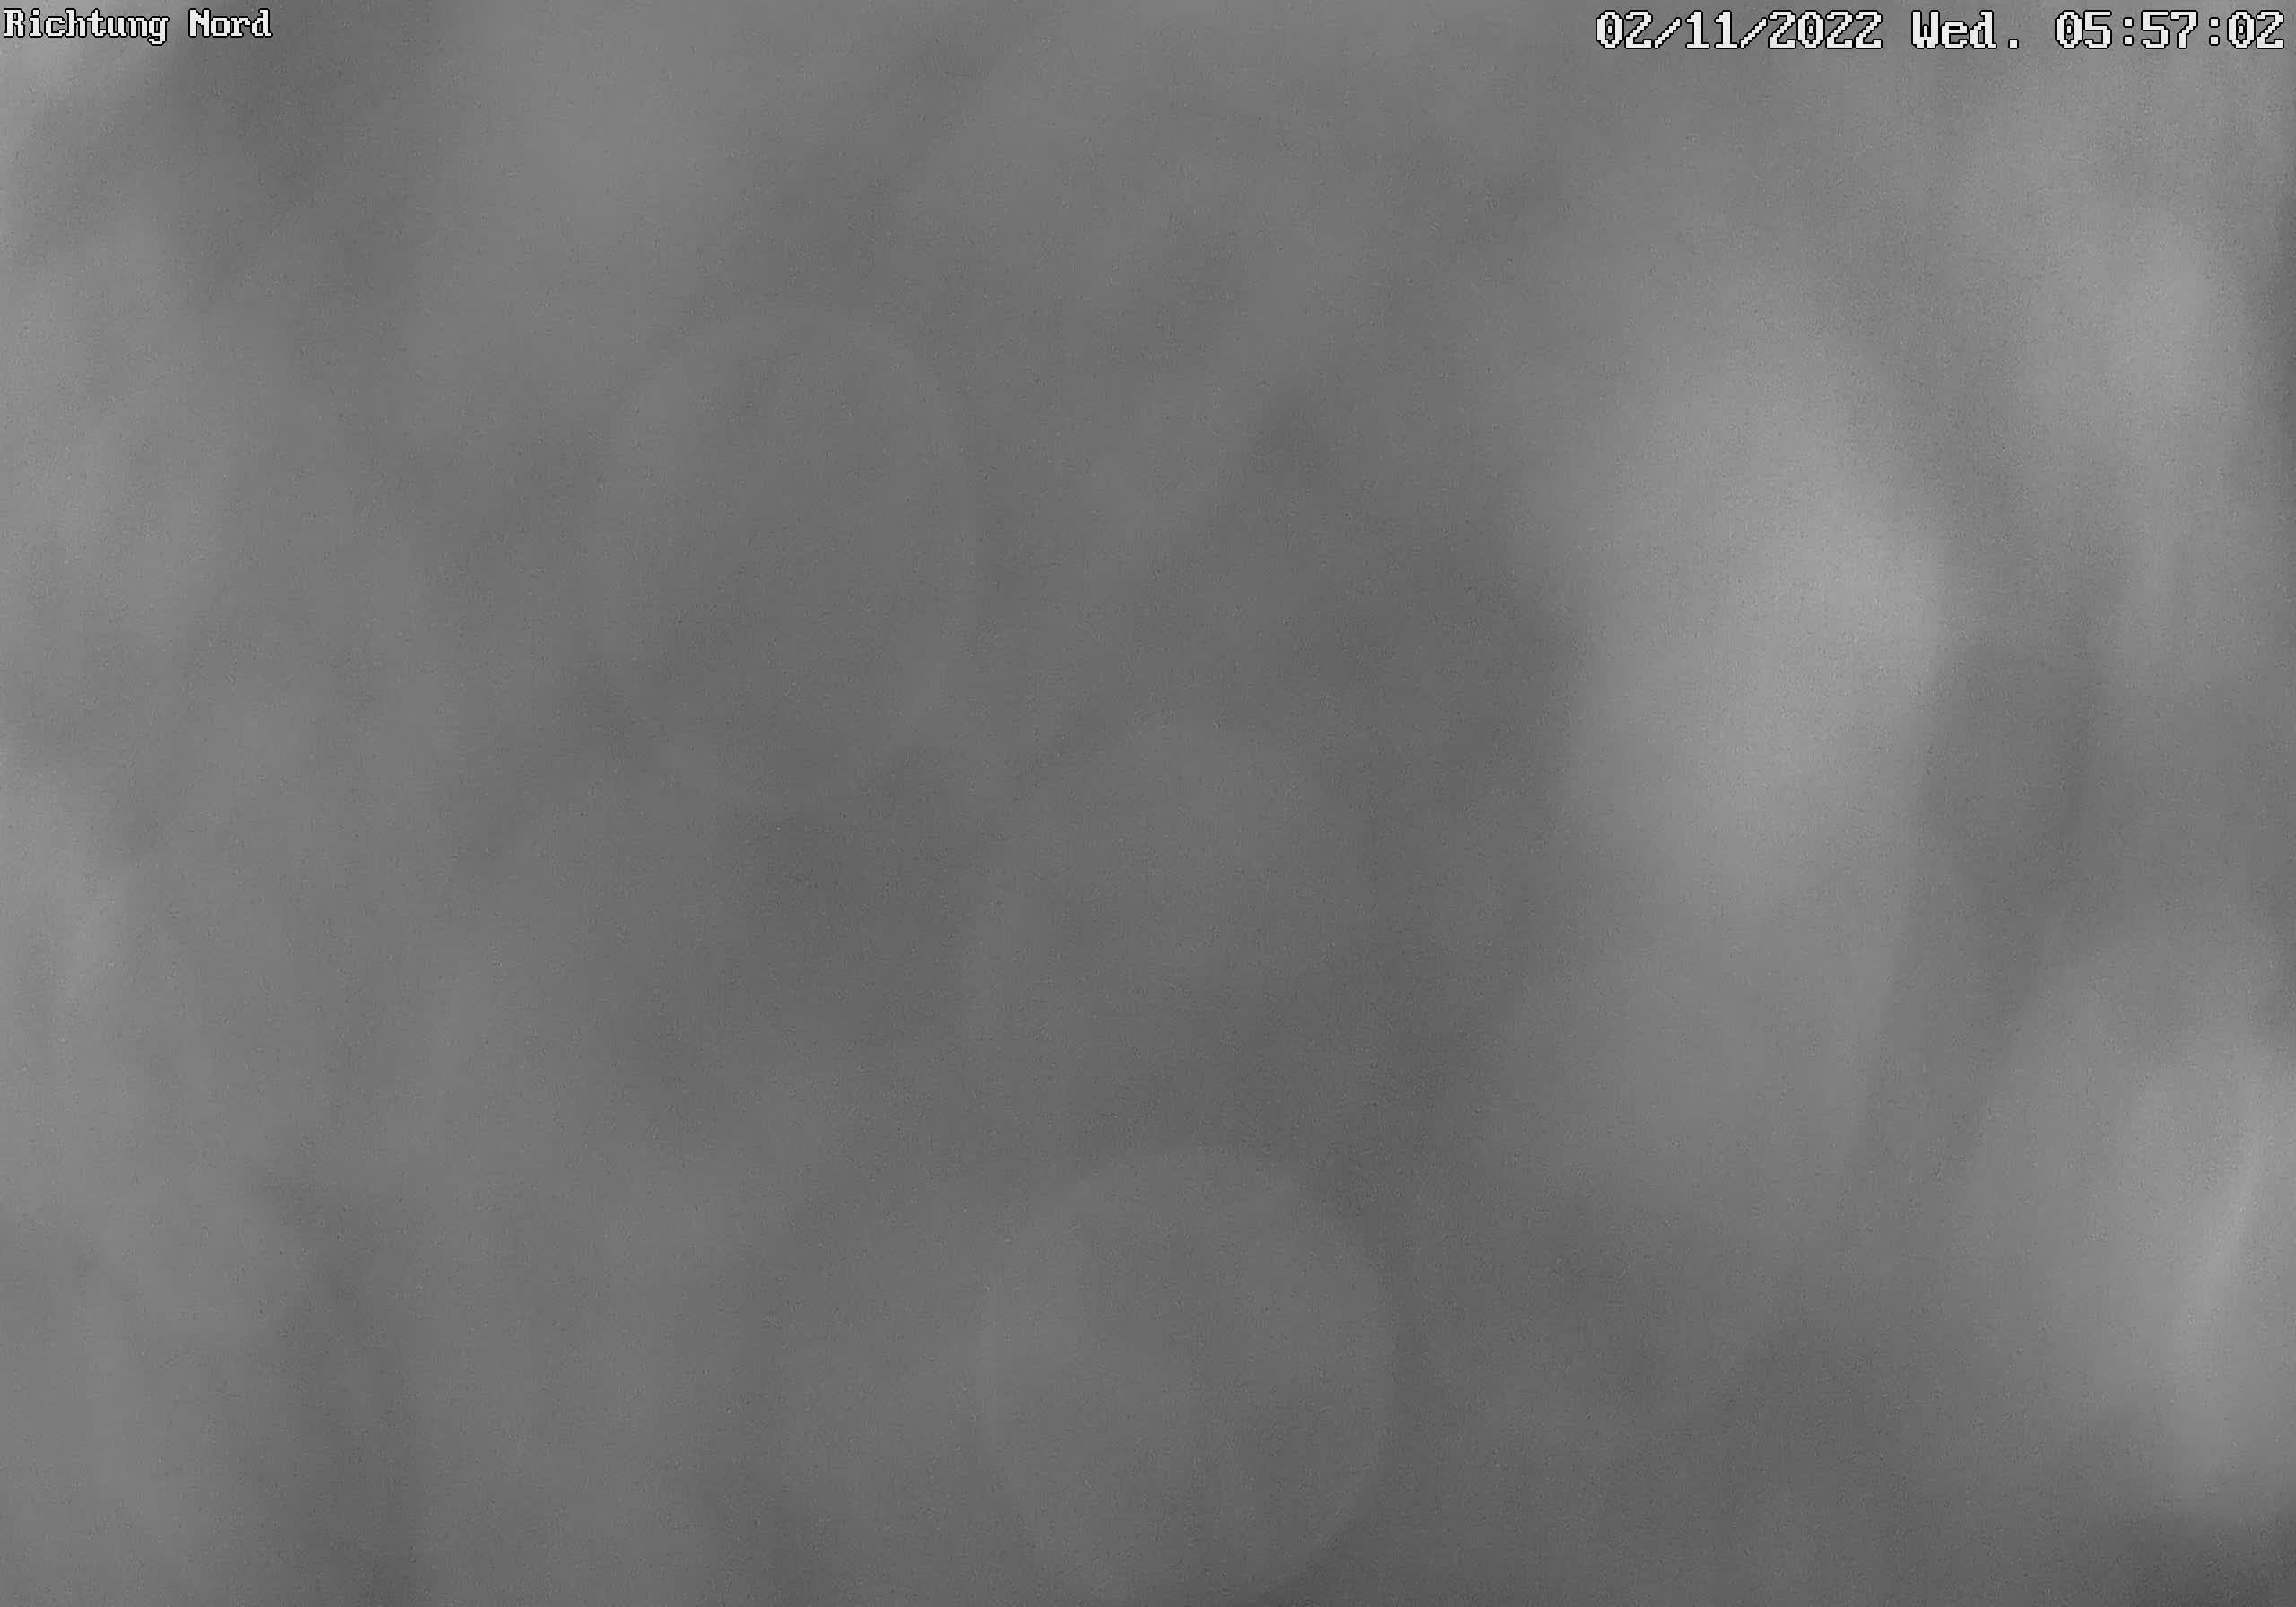
Wetter Kamera Richtung Nord
| Oktober 2026 | ||||||
|---|---|---|---|---|---|---|
| Mo | Di | Mi | Do | Fr | Sa | So |
| 1 | 2 | 3 | 4 | |||
| 5 | 6 | 7 | 8 | 9 | 10 | 11 |
| 12 | 13 | 14 | 15 | 16 | 17 | 18 |
| 19 | 20 | 21 | 22 | 23 | 24 | 25 |
| 26 | 27 | 28 | 29 | 30 | 31 | |
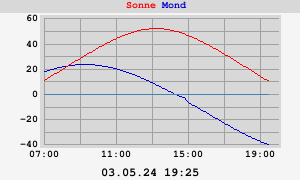
Sonne Mond
WeeWX Aktualisierung: 00:30 Uhr
DWD Warnungen: 27.10.2026 00:23 Uhr
Aeris AQI: 26.10.2026 23:00:00 Uhr
| Feinstaub PM 1 |
Aktuell | Trend | ||
| 17,5 µg/m³ | ⇩ | -4,8 | ||
| Heute seit Mitternacht |
max | 21,0 | min | 14,0 |
| Werte Gestern |
max | 175,0 | min | 2,0 |
| Tagesmittelwert | ||||
| Mittel | 18,2 µg/m³ | |||
| stündlicher Mittelwert | ||||
| Mittel | 18,2 µg/m³ | |||
| Fehlerwert | max | 12 % | min | 11 % |

| Feinstaub PM 2,5 |
Aktuell | Trend | ||
| 21,2 µg/m³ | ⇩ | -8,2 | ||
| Heute seit Mitternacht |
max | 30,0 | min | 18,0 |
| Werte Gestern |
max | 217,0 | min | 2,0 |
| Tagesmittelwert | ||||
| Gut | 22,5 µg/m³ | |||
| stündlicher Mittelwert | ||||
| Gut | 22,5 µg/m³ | |||
| Fehlerwert | max | 13 % | min | 12 % |
| Feinstaub PM 10 |
Aktuell | Trend | ||
| 22,5 µg/m³ | ⇩ | -8,5 | ||
| Heute seit Mitternacht |
max | 32,0 | min | 18,0 |
| Werte Gestern |
max | 229,0 | min | 2,0 |
| Tagesmittelwert | ||||
| Gut | 23,7 µg/m³ | |||
| stündlicher Mittelwert | ||||
| Gut | 23,7 µg/m³ | |||
| Fehlerwert | max | 13 % | min | 12 % |
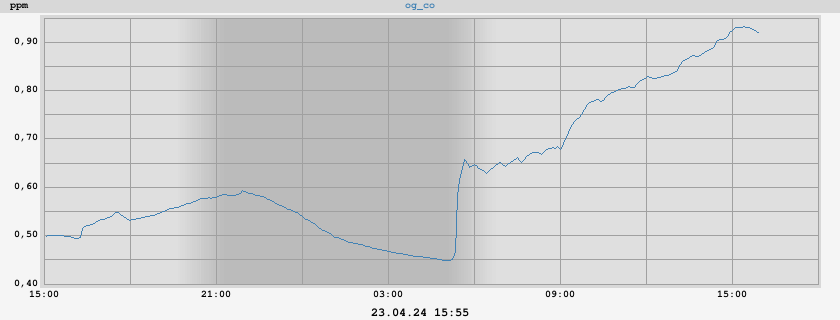
| Kohlenmonoxid CO-Sensor |
Aktuell | Trend | ||
| 0,3 mg/m³ | ⇩ | -0,1 | ||
| entspricht rund: | 0 ppm | |||
| Heute seit Mitternacht |
max | 0,3 | min | 0,3 |
| Werte Gestern |
max | 1,1 | min | 0,1 |
| Tagesmittelwert | ||||
| Gut | 0,3 mg/m³ | |||
| stündlicher Mittelwert | ||||
| Gut | 0,3 mg/m³ | |||
| Fehlerwert | max | 0 % | min | 0 % |
| Kohlendioxid CO2 Sensor |
Aktuell | Trend | ||
| 816 ppm | ⇩ | -26 | ||
| entspricht rund: | 1495,5 µg/m³ | |||
| Heute seit Mitternacht |
max | 824 | min | 810 |
| Werte Gestern |
max | 917 | min | 717 |
| Tagesmittelwert | ||||
| Gut | 818 ppm | |||
| stündlicher Mittelwert | ||||
| Gut | 818 ppm | |||
| Fehlerwert | max | 75 % | min | 74 % |

| Stickstoffdioxid NO2 Sensor |
Aktuell | Trend | ||
| 10,1 µg/m³ | ⇩ | -0,5 | ||
| entspricht rund: | ||||
| Heute seit Mitternacht |
max | 10,5 | min | 9,8 |
| Werte Gestern |
max | 19,8 | min | 7,0 |
| Tagesmittelwert | ||||
| Gut | 10,1 µg/m³ | |||
| stündlicher Mittelwert | ||||
| Gut | 10,1 µg/m³ | |||
| Fehlerwert | max | 4 % | min | 4 % |

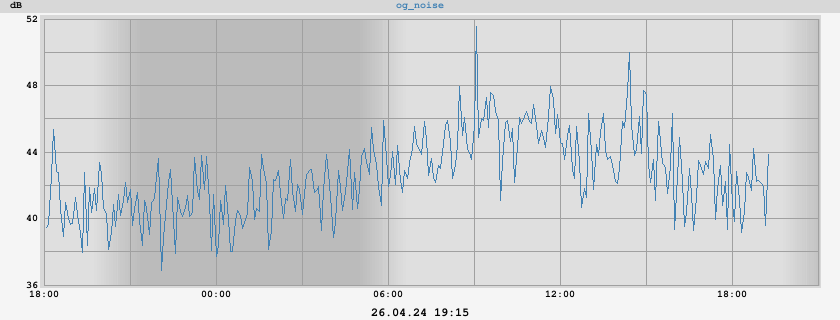
| Sound- sensorLärm |
Aktuell | Trend | ||
| 42 dB | ⇧ | 0 | ||
| Heute seit Mitternacht |
max | 59 | min | 36 |
| Werte Gestern |
max | 89 | min | 21 |
| Tagesmittelwert | ||||
| 42 dB | ||||
| stündlicher Mittelwert | ||||
| 42 dB | ||||
| Fehlerwert | max | 7 % | min | 2 % |
| CO2Delta in ppb/s |
Aktuell | Trend | ||
| 17,18 | ⇧ | 1,94 | ||
| Heute seit Mitternacht |
max | 27,40 | min | 0,02 |
| Werte Gestern |
max | 240,18 | min | 0,00 |
| Tagesmittelwert: 9,782 | ||||


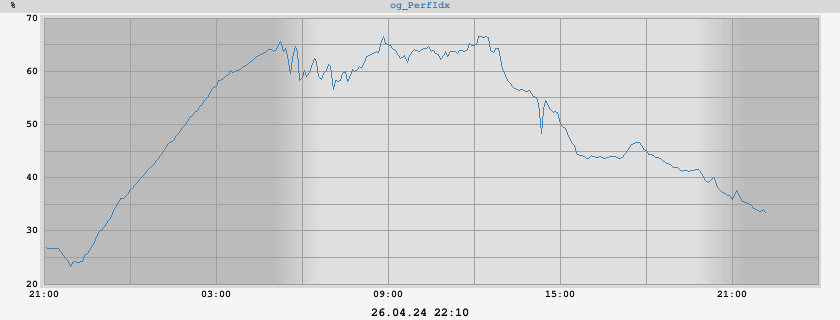
| Leistungs- index |
Aktuell | Trend | ||
| 42 % | ⇩ | -1 | ||
| Heute seit Mitternacht |
max | 43 | min | 41 |
| Werte Gestern |
max | 65 | min | 27 |
| Tagesmittelwert: 42 % | ||||
| Gesundheits- index |
Aktuell | Trend | ||
| 33 % | ⇧ | 10 | ||
| Heute seit Mitternacht |
max | 42 | min | 25 |
| Werte Gestern |
max | 86 | min | 0 |
| Tagesmittelwert: 31 % | ||||


| AirQ Luftdruck |
Aktuell | Trend | ||
| 1016,7 mbar | ⇩ | -0,4 | ||
| Heute seit Mitternacht |
max | 1017,0 | min | 1016,7 |
| Werte Gestern |
max | 1017,4 | min | 1003,5 |
| AirQ Altimeter |
1016,7 mbar | |||
| AirQ Absoluter Luftdruck: 1010,5 mbar | ||||

| Delta Auslesen (s) |
Aktuell | Trend | ||
| 1994 | ⇩ | -14 | ||
| Heute seit Mitternacht |
max | 2138 | min | 1718 |
| Betriebszeit | Aktuell | |||
| 37 Minuten, 45 Sekunden | ||||


| AirQ Server Feinstaubsensor |
| PM 2,5 |
| PM 10 |
| weiter |